
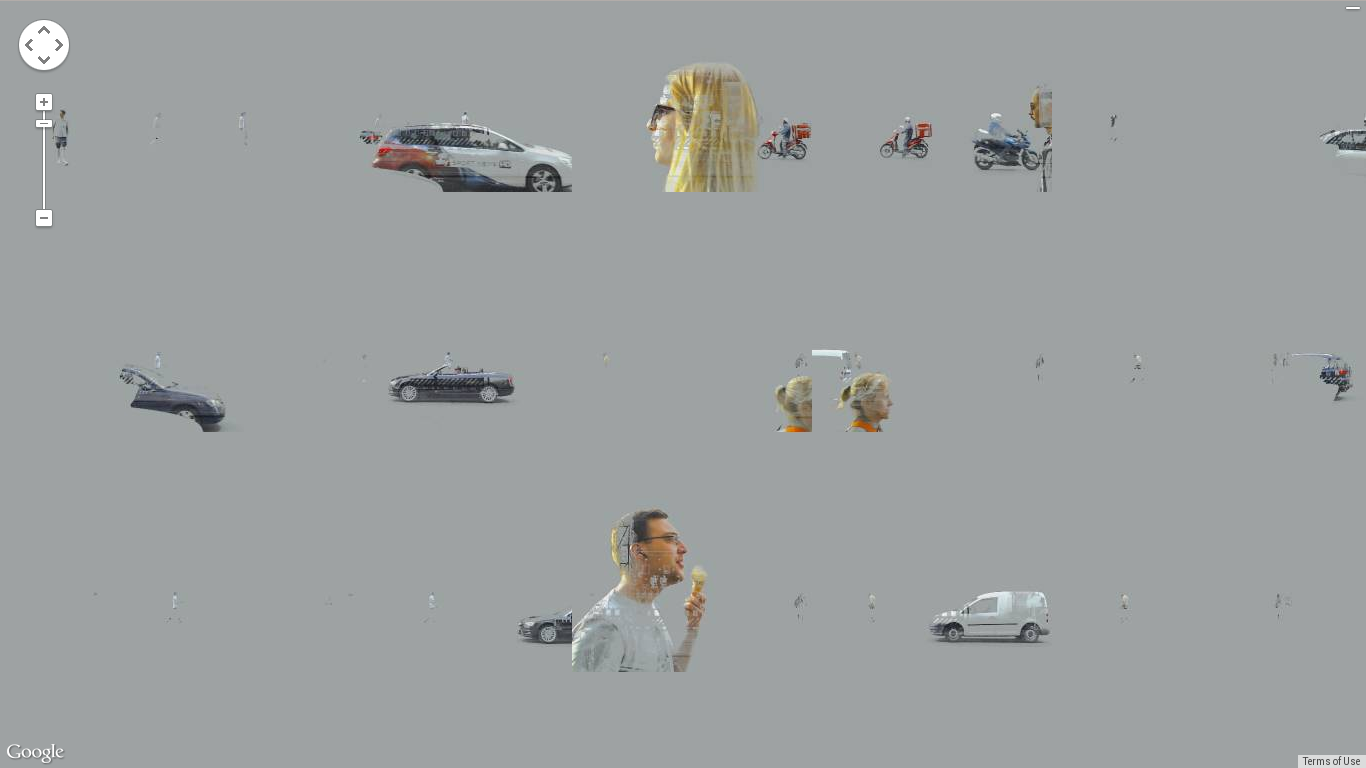
What are you looking at? Mostly nothing.
Four weeks of surveillance video in one image.
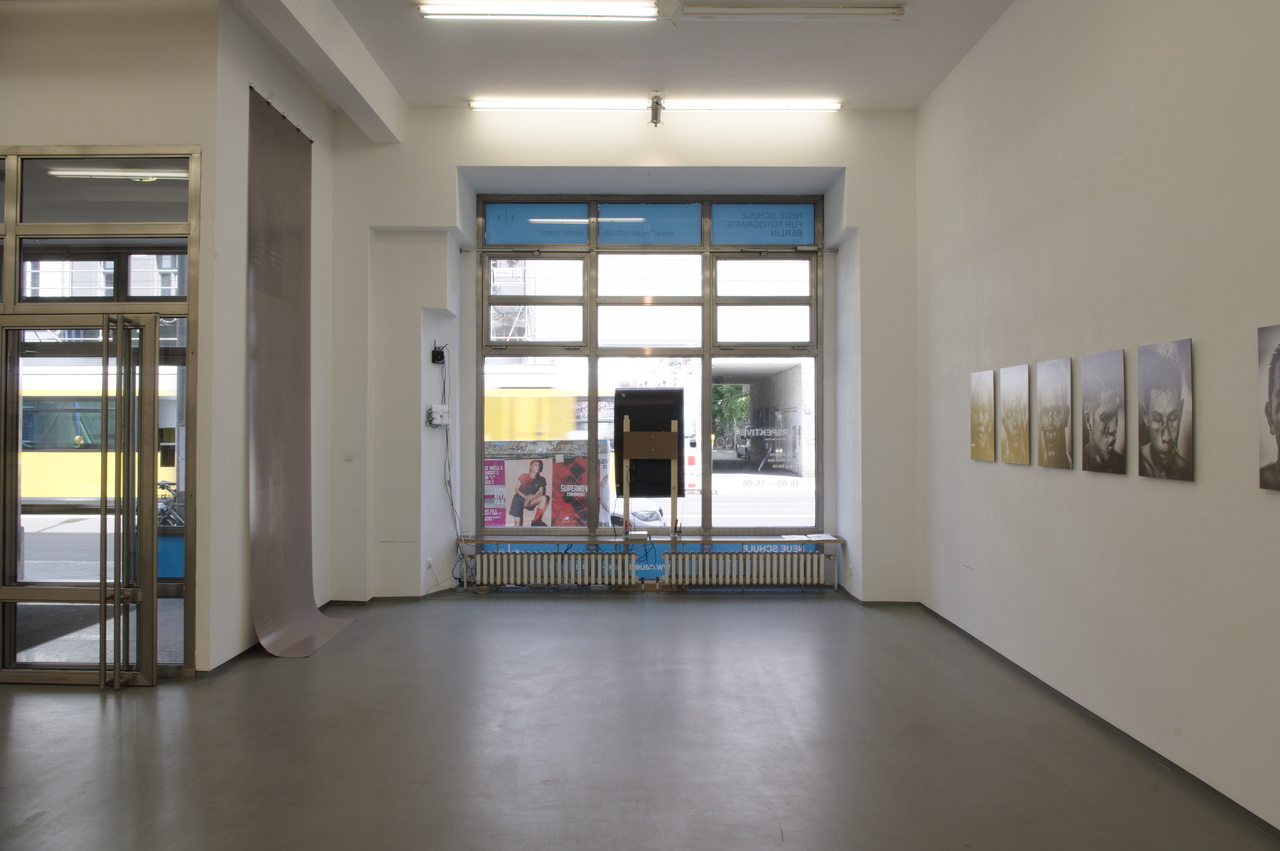
“Two billion pixels per hour” was part of Neue Schule für Fotografie Berlin‘s first alumni exhibition “Perspektiven” in May/June 2014, which featured current works by Patrik Budenz, Tobias Wirth and me.
![]()
How it works
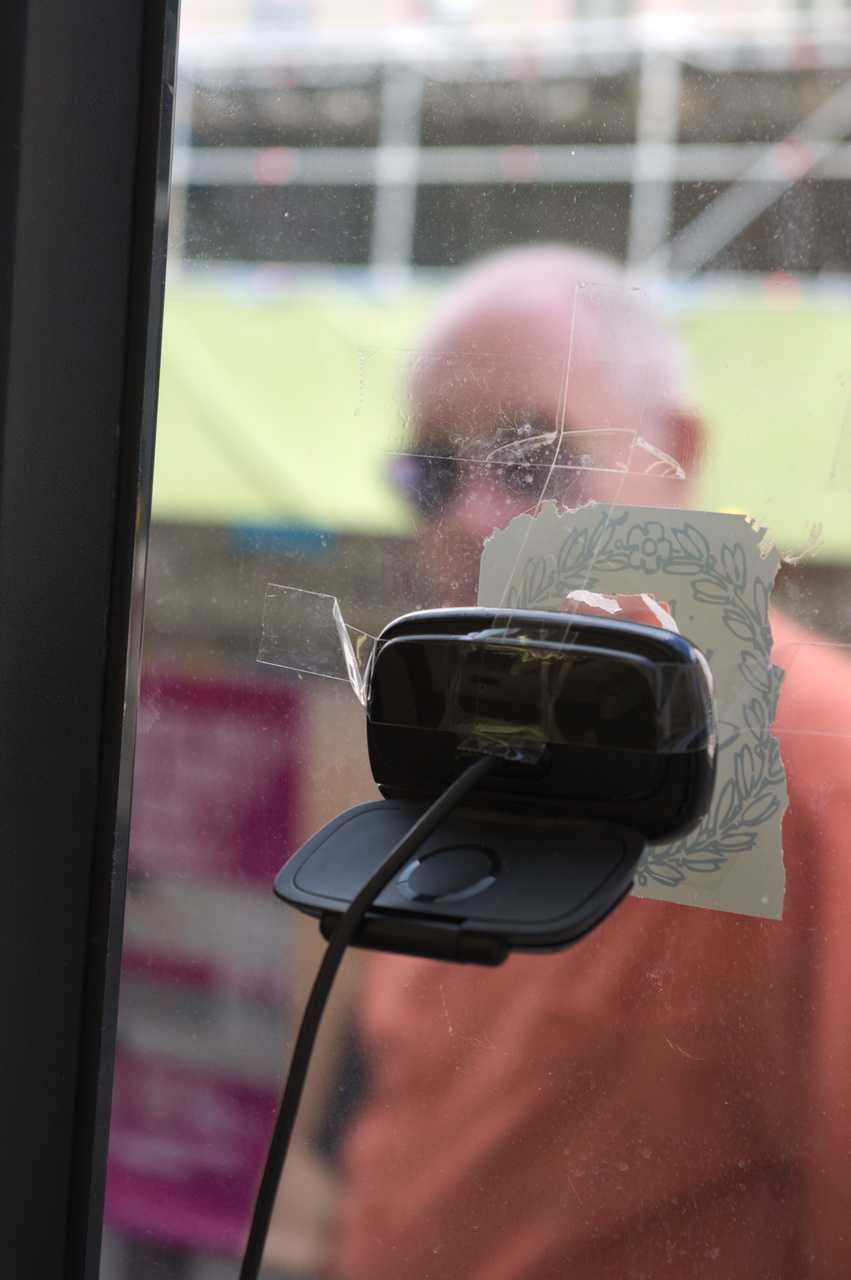
- A camera stares¹ out the gallery’s display window.
- It takes roughly two pictures per second, that’s 4 million total over 4 weeks.
- The still background is removed from the picture stream.
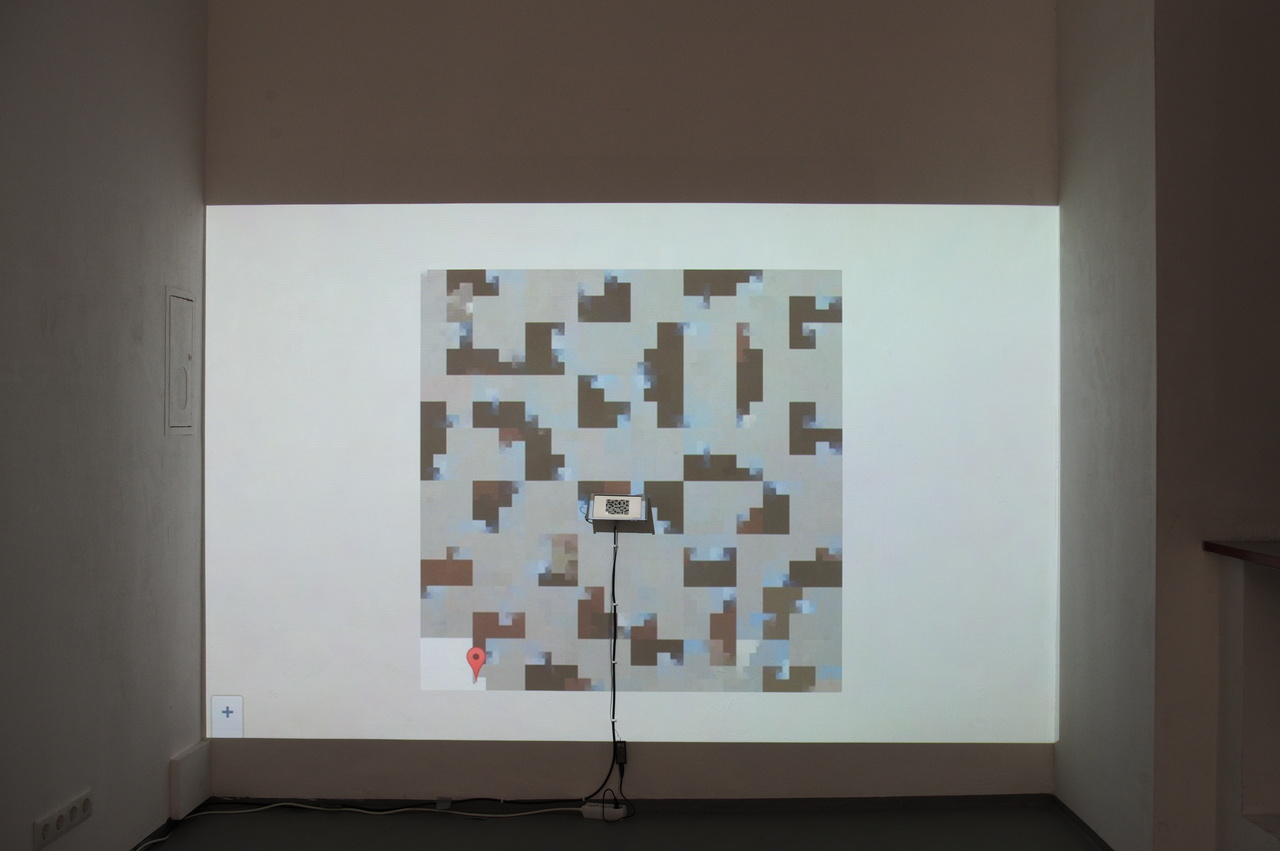
- Each picture is sequentially placed onto a giant² virtual canvas, following a fractal curve. It’s like the video’s temporal dimension is folded/crumpled into 2D space. Events (pedestrians, cars, trains, nights, rush hours, weekends) form clusters.
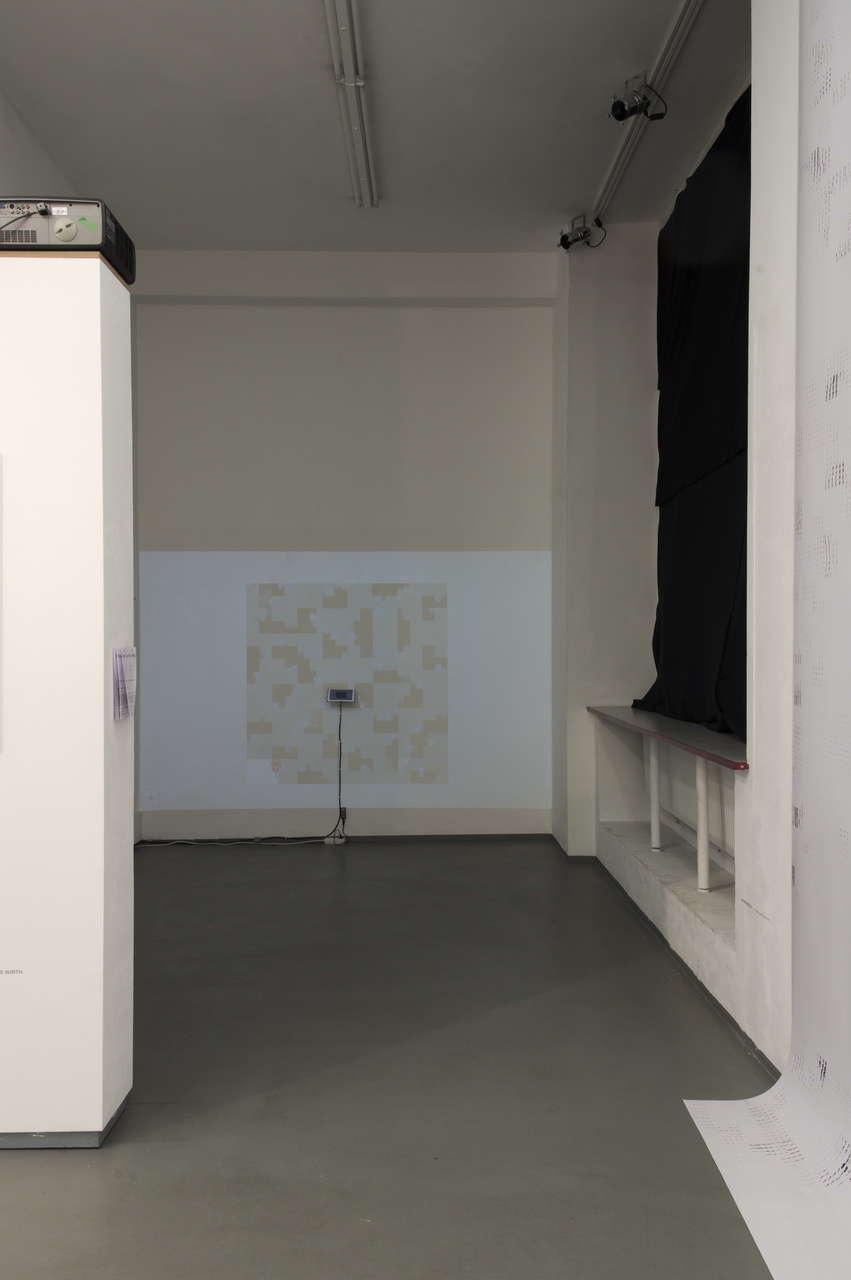
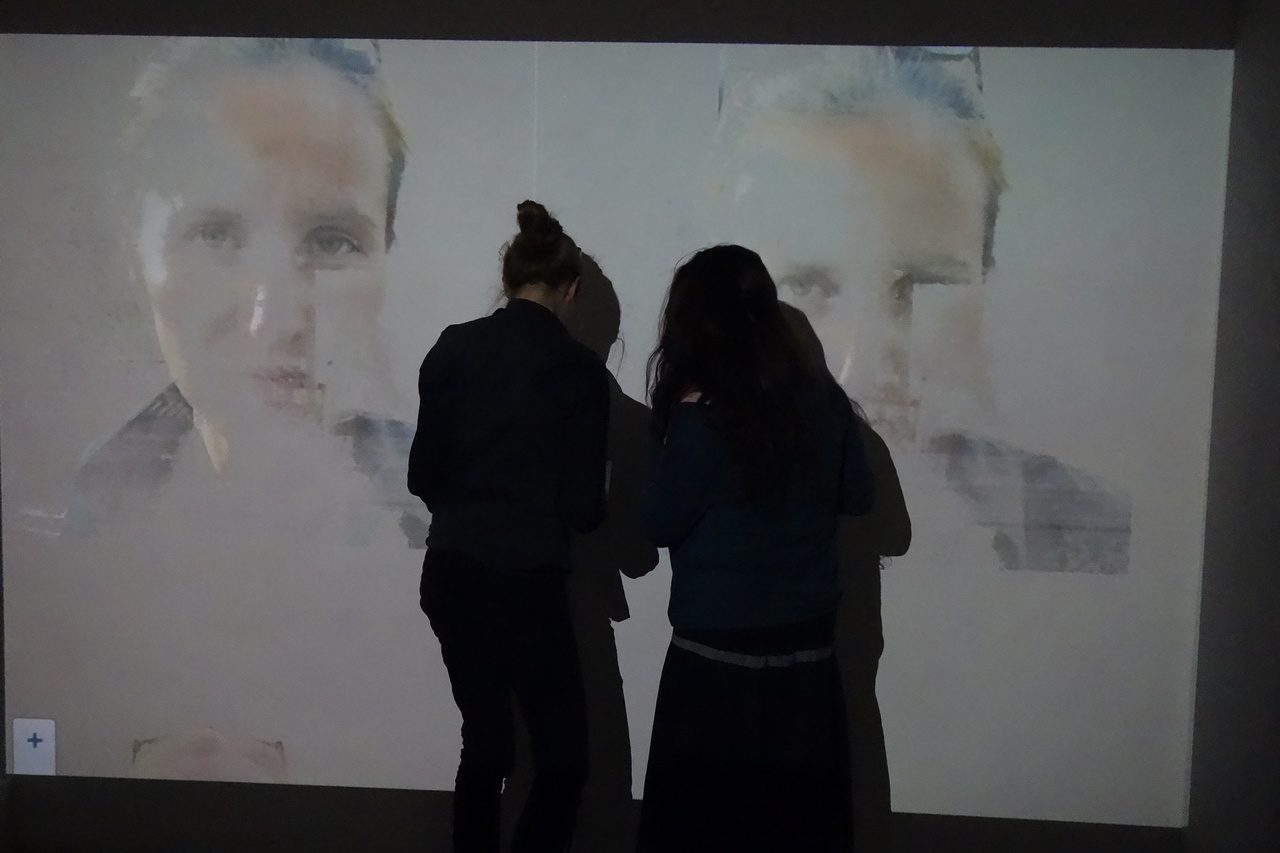
- A screen in the display window shows random peeks into the image. Inside the gallery, an iPad running Google Maps software allows thorough examination of the growing image.
¹ the stare streetviewed
² printed size at 300 dpi: 60×60m ≃ 1 acre
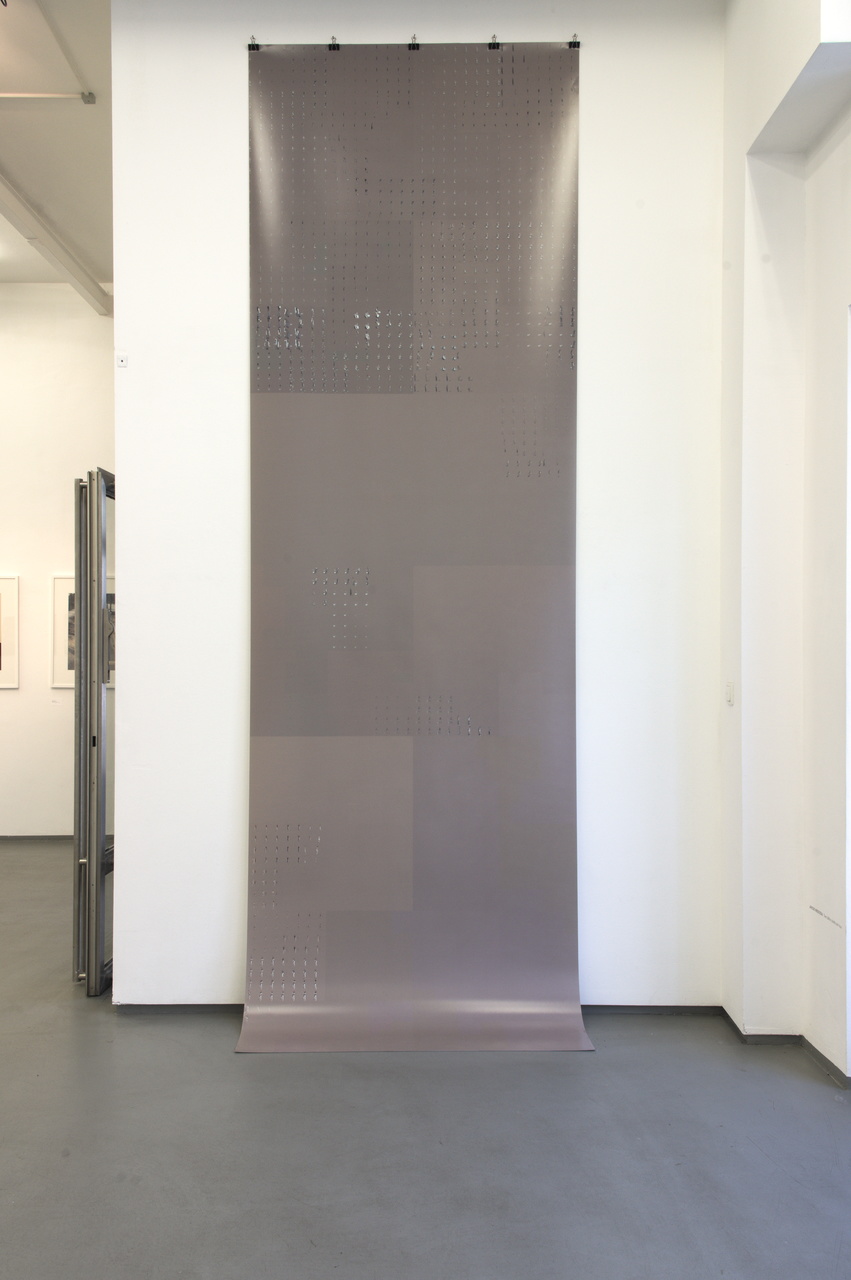
Exhibit pics

Printouts
I subjected myself to surveillance (“sousveillance“).
Two printouts of this material were part of the exhibition:
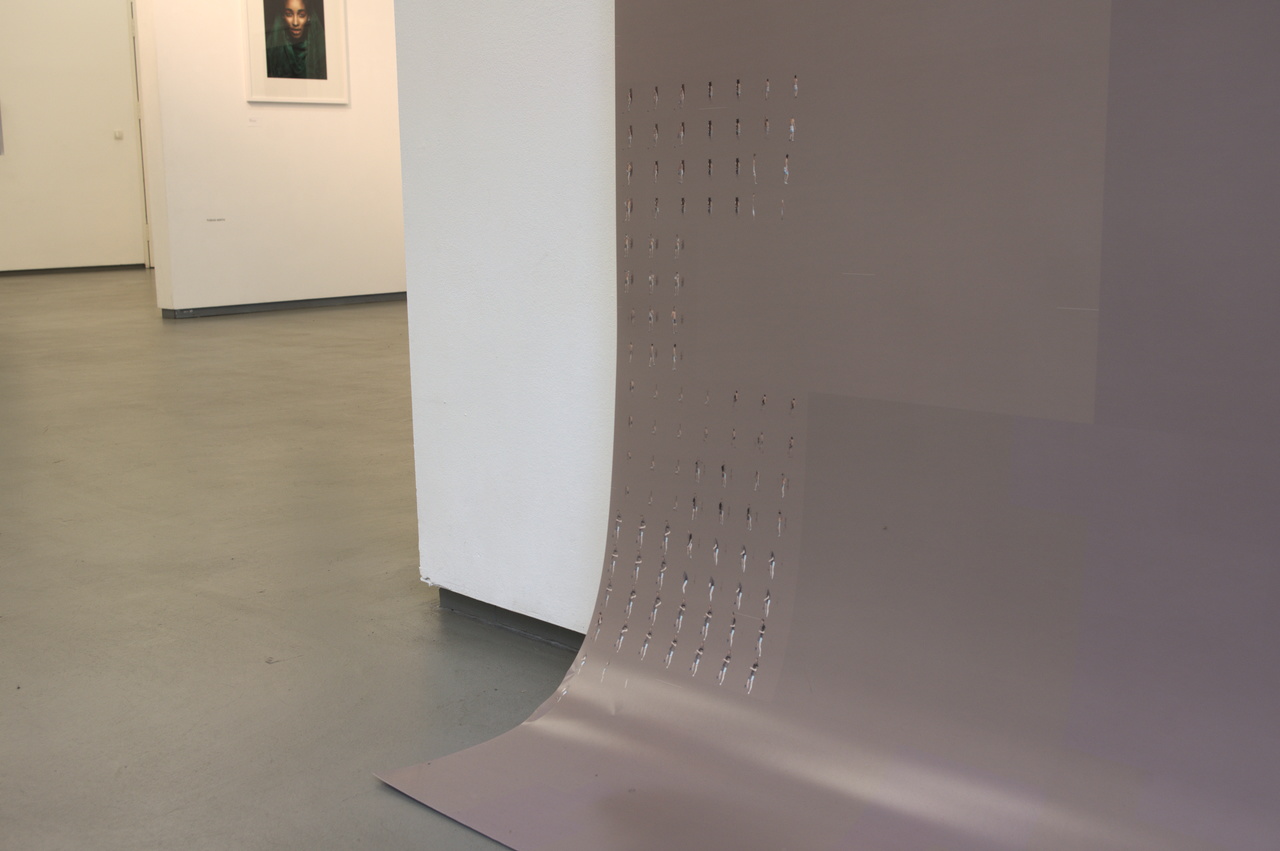

![]()
The right/latter one is a tiny part of the print in full resolution. You can check out the 21 Megapixel version here (that’s still only 2.8% of the original).
Technical details
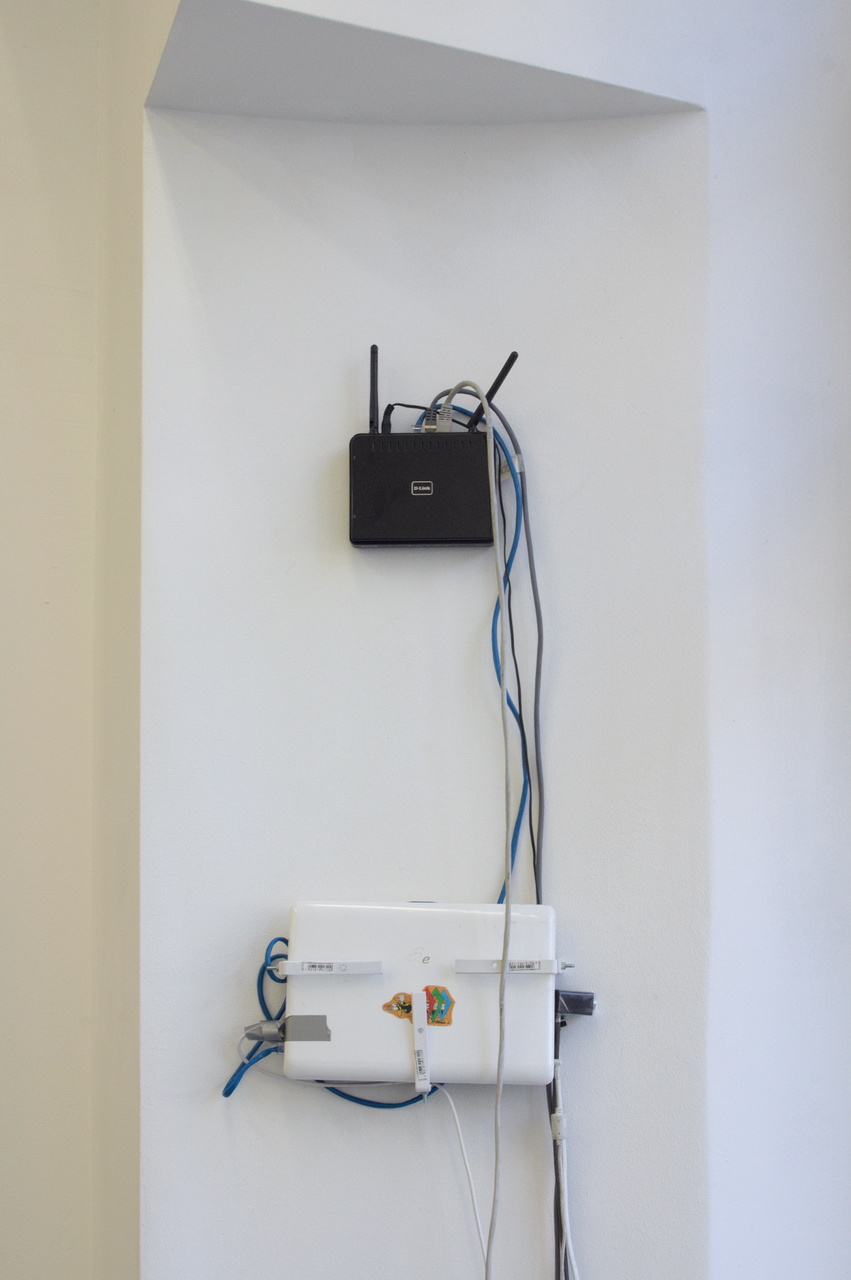
I like my stuff to run on readily available, consumer entertainment electronics:
- 42″ TV
- 720p webcam (the UVC-compatible Logitech C510)
- WiFI router (D-Link DIR 615)
- Mac mini
- some HD projector
- iPad mini Retina
- my old trusty Asus Eee Netbook (1005HA) = automatic 12 hour UPS
![]()
- The router ran DD-WRT
- The Mac mini’s native Safari was slower than a Chromium running from a Ubuntu LiveCD…
- That LiveCD was customized to boot into a portrait full-screen browser, with several scripts to monitor sanity.
- The iPad ran Safari in iOS 7.1′s native “Guided Access” kiosk mode.
- The display “client” is basically the Google Maps API v3′s JavaScript library, forced to periodically refresh its tiles; and a loop that zooms in-and-out to a random point in the past, or “now”, respectively.
- On the “server”:
- Ubuntu
- a python script, mashing up:
- an amalgam of several Hilbert curve scripts
- image grabbing & manipulation via OpenCV and numpy
- background removal via a combination of a homegrown algorithm and OpenCV 3′s MOG Background substraction methods
- a homegrown algorithm for very slow automatic exposure
- lighttpd
- a reverse autossh tunnel for remote monitoring from home
![]()
Prototype
An earlier version of the machine recorded 3 days of data at HGB Leipzig’s Rundgang 2014.
The big data
![]()
![]()
![]()
![]()
![]()
![]()
![]()
There’s even more in the blog.
Flyer
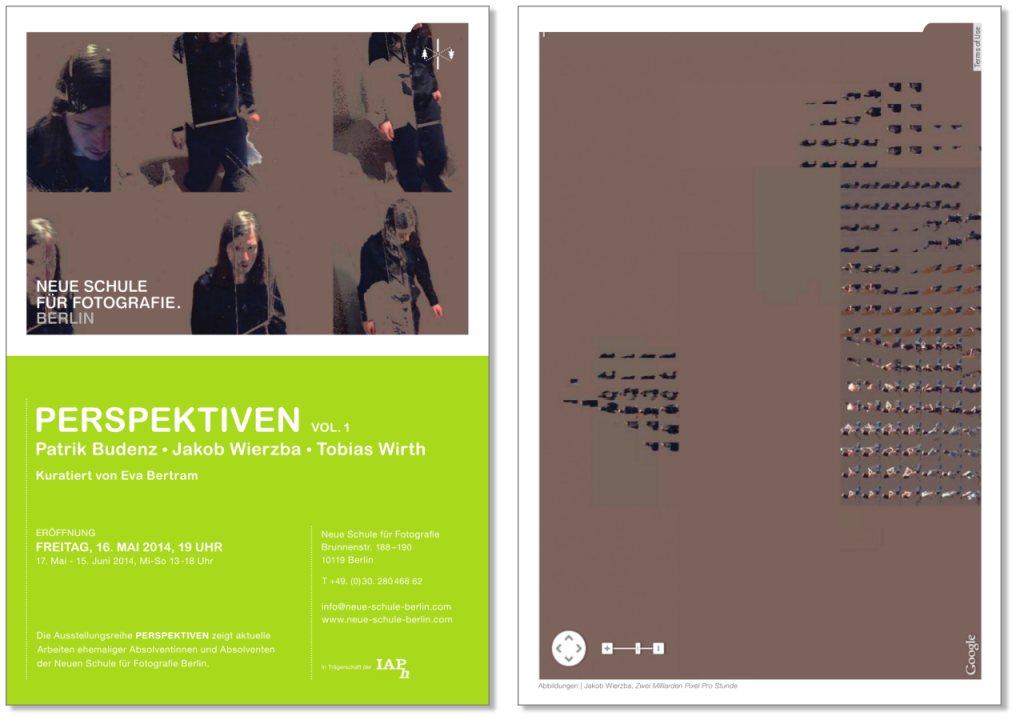
…featuring some test footage.